
Problem Statement
With the growth of our user base and increasing traffic to the web servers, we wanted to come up with some realtime counters to measure traffic.
We wanted the system to give us an idea of:
- The total web requests the site is receiving each minute
- These totals aggregated hourly and displayed for the day (24 entries)
- The counts broken up by the specific request path
- The number of unique visitors broken up by the minute, hour and day
Limitations of available solutions
We use Heroku for deploying the app. The Heroku dashboard provides us a rough idea of the request counts, but it is difficult to incorporate that into our own operational dashboards. Also Heroku doesn't break down the counts by the request path, which was important to us in understanding the source of traffic and how we could scale resources based on the source. Unique visitor counts are similarly an important metric not readily available.
Counters help scale the app
Breaking down the traffic by the source was important in coming up with a way to efficiently scale our service. Currently most of our application sits in a single service. So scaling the app means we add machines to this single fleet, even though only requests from one or two sources really benefit from this added capacity.
We have 3 main sources of traffic:
- Our users hit the service for various features provided from their mobile app
- Our users send us their geo location from the mobile app
- We receive near real-time data of our users gig work from a third party
Our primary application performance goal is providing a sub second experience to users as they use our mobile app; thus mainly, we want to optimize resourcing on the backend with a focus on 1.
However, we get so much more traffic from 2. and 3. which consume most of the server bandwidth. Keeping all three services as a single service degrades the experience for the user.
Mind you, 2. and 3. do not have a real time processing requirement. While a web server is needed to accept these requests, the actual processing is handled by an asynchronous worker outside of the web server.
But still, since there are so many of these web requests, for the few milliseconds each of them sit on the web server, it takes away bandwidth from the user requests.
Why Redis?
Redis provides the ideal data structures for counting requests with minimal overhead. (And must I say that it is fast, as in really, really fast) A few keys can be used to keep a running total for each minute per request type, then a sorted set can be used to aggregate the last N minutes of requests. (For our purposes, we decided to keep 60 counts, thus providing a picture of activity for the last hour, but you can choose to keep counts for longer than that.)
The same idea can be extended to measure days worth of traffic broken by the hour.
Choice of the Sorted Set
Why did we decide on the sorted set for aggregating the counters? Well, the sorted set allows us to have the counters sorted by time. This way, we can quickly get the list of counts for the last hour ordered from minute 1 down. To be fair, it is a bit overkill to use a set for this, as we are never going to be mutating an element (since the timestamp is always increasing), but it does suit our purposes just fine!
Before going any further, let us briefly recap the salient features of the sorted set. It allows us to insert elements along with a score, and the elements are sorted in real time by the score. It scales really well for even millions (or more) of elements as each insert operation takes O(log(n)) time -- much like a binary tree. While we do not need that level of scale, one can think of keeping extremely granular counts for a long period of time, which could come in handy for debugging bizzare performance problems after the fact!
We can use the timestamp as the score. Redis will then always sort the set by the timestamp. This has the advantage that if you wanted to change the counter later (imagine a design where you quickly provide a rough estimate of the count, but later do a second pass to provide exact counts), you can simply add a new count to the set with the same timestamp and the position of the element will not change.
The counters will need to be reset at the start of the minute. I first made the mistake of using the expiry time of the key set to 1 minute, but realized that this introduces a race at the point of aggregating the count on to the sorted set. Which is that we may be unlucky that before the aggregation, redis could have expired the key, resulting in a substantial undercount in the set. (This was a difficult bug to track down, and of course the most obvious, I had a face-palm moment as you can imagine.)
There is a slight difficulty we need to work around here w.r.t the sorted set. If we keep the count as the element in the set, a count that happens to be the same as one already stored will replace the previous count (with the score modified). Since we are using the timestamp as the score, this will essentially remove the entry we had for the earlier timestamp. This is how sets work after all - it is a data structure suited for keeping unique members. But we can easily overcome this by prepending the timestamp of the count to the count and storing that as the element of the set. To read the count, we merely have to split the element by the delimiter (we used the colon here for the delimited, which is somewhat of a standard in redis for splitting keys), and use the second part.
A look at the running counters
A ZRANGE command can retrieve the counts like so:

Counting the unique visitors is only slightly more involved. First we need to keep a regular Redis set and update it for each request. In our case, the user id is encoded in the request header, we decode it and add it to the Redis set. Now if the same user visits the site again, since we are using a set, we will not add it again, and we still have just one element in the set. This way, we can take the length of the set at any point and know how many unique visitors we have from the time we started writing to the set.
The only thing left to do is, create the set at the start of the time interval we need to measure the count, and reset it at the end of the time interval. So we can set this up to reset every minute for a minute by minute count of unique visitors. Then we can use the infrastructure we built above to aggregate the count over to the sorted set, so we have a running count of unique visitors for the past N minutes.
(You may have a different technique for figuring out the ID of the user making the request. Once the ID is extracted, you can use a Redis set to keep track of the visit.)
Here is how we see the unique visitor count changing dynamically:
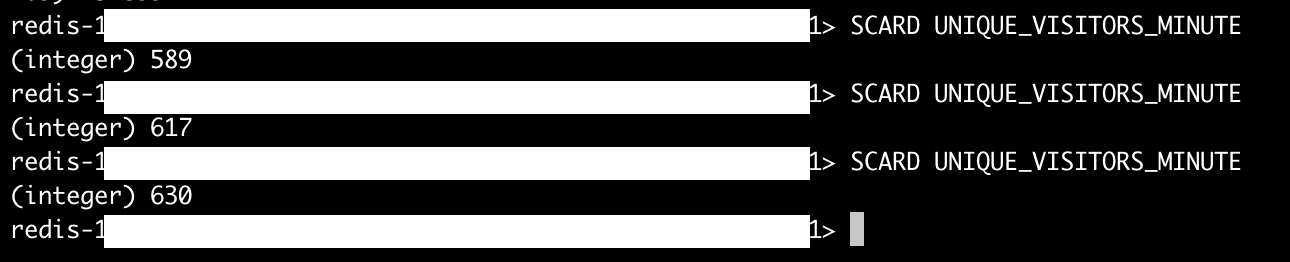
We can just as easily use another excellent Redis command to see all the user ids in this set. Here is a snippet in our case :

Implementation
We implemented the counters using Ruby, with the redis gem as our client. This involves several steps:
- Initializing the counters
- Resetting the counters at minute, hour, day intervals
- Incrementing the appropriate counters for each request
- Aggregating the count onto the set
The first two steps can be combined. We used a scheduler that sits within the app via the ruby clock gem. Heroku allows provisioning a single process that runs a scheduler based on the schedule we set via the ruby clock. This is pretty similar to how one would use cron on a Unix machine to schedule a task.
Heroku does provide a scheduler as well. We did not use it as it does not have the same reliability guarantees as the ruby clock gem. I have seen cases where the Heroku scheduler does not fire and fires very late, all documented behaviors.
Since we use Rails for our app, we utilized its framework built on top of controllers to track request counts.
A controller encapsulates serving requests for a specific web route (think of this as having one controller for yoursite.com/user/login and another controller for yoursite.com/reports/account). Now each controller is a subclass of a class we implement called ApplicationController which itself is a subclass of the Rails class ActionController::Base.
Rails allows us to hook all requests at the ApplicationController level with a simple before_action hook. We implemented the request counting using this hook, and it looks something like this:
class ApplicationController < ActionController::Base before_action :update_usage_counters def update_usage_counters PerfCounters.increment(user_id: current_user&.id, request_path: request&.fullpath) end end
Now each request goes through update_usage_counters, which delegates the work to the PerfCounters class we wrote. request is an object provided by the Rails routing framework, and request.fullpath contains the URL. The method current_user (not shown) extracts the logged in user's ID from the request headers.
I will reproduce pieces of a simplified version of PerfCounters that will illustrate the logic:
The incrementing logic looks like this:
class PerfCounters def self.increment(user_id:, request_path:) $redis.pipelined do |pipeline| if user_id.present? pipeline.incr('USER_REQUESTS_MINUTE') pipeline.sadd('UNIQUE_VISITORS_MINUTE', user_id) if request_path&.include?("/geo/send") pipeline.incr('GEO_REQUESTS_MINUTE') end else pipeline.incr('OTHER_REQUESTS_MINUTE') end end end end
Notice that a request made on behalf of a logged in user will have user_id parameter set. The request_path is the path of the URL, and we use it here to separate the counts made to track the location of the user.
Another neat redis feature we use here is pipelining. The idea is that if we need to make a number of independent requests to redis, we can open a socket to the redis server and send all that data and close the socket at the end. Redis server will return an array of replies in order after it processes all requests. This is a powerful feature that is more efficient than creating a socket for each separate request. It is not without cost - as the server has to buffer each request, technically blocking the request thread from processing other requests. The rule of thumb is to make sure that each request is pretty fast - O(1) would be ideal, and to not pipeline too many requests in a single call. As with everything, you must test this against all the other traffic you serve and compromise if you must!
Also notice that we are demonstrating the use of three counters USER_REQUESTS_MINUTE, GEO_REQUESTS_MINUTE and OTHER_REQUESTS_MINUTE, alongside a set called UNIQUE_VISITORS_MINUTE. This last one actually keeps the user ids of all visitors. The sadd command adds the visitor id to the set upon the first time we see them.
The ruby clock gem takes its inputs via a file named Clockfile. This is in fact a file that uses ruby syntax, i:e it is evaluated by the ruby interpreter. All we do is define the aggregator to run every minute, like so:
schedule.cron '* * * * *' do PerfCounters.aggregate_minute end
This is what the minute aggregation looks like:
def self.aggregate_minute tm_obj = Time.current - 1.minute # aggregate last minute's stats tm = tm_obj.to_i # get all current minute counters, add them to the hour list before zeroing them out user_rpm, other_rpm, geo_rpm, unique_visitors_last_minute = $redis.pipelined do |pipeline| pipeline.get('USER_REQUESTS_MINUTE') pipeline.get('OTHER_REQUESTS_MINUTE') pipeline.get('GEO_REQUESTS_MINUTE') pipeline.scard('UNIQUE_VISITORS_MINUTE') end $redis.pipelined do |pipeline| # ZADD key score value : keep timestamp as score so we get the counters sorted by time # append the timestamp to the counter to make sure entries don't overwrite. pipeline.zadd('USER_REQUESTS_LAST_HOUR', tm, "#{user_rpm}:#{tm}") pipeline.zadd('OTHER_REQUESTS_LAST_HOUR', tm, "#{other_rpm}:#{tm}") pipeline.zadd('GEO_REQUESTS_LAST_HOUR', tm, "#{geo_rpm}:#{tm}") pipeline.zadd('UNIQUE_VISITORS_LAST_HOUR', tm, "#{unique_visitors_last_minute}:#{tm}") pipeline.del('USER_REQUESTS_MINUTE') pipeline.del('OTHER_REQUESTS_MINUTE') pipeline.del('GEO_REQUESTS_MINUTE') pipeline.del('UNIQUE_VISITORS_MINUTE') end end
As you can see, there are two types of counters. One tracks the count for each minute, the other aggregates it for the hour. So for example, take USER_REQUESTS_MINUTE. This is incremented for each request made on behalf of a logged in user. Then upon the dawn of the minute, this counter is added to the sorted set USER_REQUESTS_LAST_HOUR and then immediately deleted.
You can chop the aggregations every Mth hour since otherwise these sets will keep growing eventually taking all of Redis memory! I won't show that code, but it should be fairly straightforward to implement.
After having implemented this solution and writing this article, I have come to see that there are other ways to implement counting using Redis. Redis provides such a versatile set of data structures and algorithms that there is always a simpler or more elegant technique somewhere!
For example, when we use a container like a sorted set or a list, we must set its bounds, clearing it at certain time intervals and thus restricting its memory usage. But if you use the Redis stack, there is an excellent data structure - the Redis Timeseries that does much of this bookkeeping for you. Basically, you can configure the time series to expire old entries (something that most other Redis data structures do not do for you - you can expire the complete key or nothing at all). Besides that it has commands very similar to the set or the sorted set.
Another advantage of a time series vs a sorted set would be the trivially simple management of a "rolling" window of counts. This is typical in performance monitoring that you want the "last 72 hours" or the last "30 days" of performance data, which is more useful than data "for all of today" or "for the current hour".
I leave this as an exercise to the reader. Maybe I can talk about this in greater detail in a future article as well!