Thursday, October 16, 2025

Rails 8: - can't cast RSpec::Mocks::Double

 One of the first unit test failures I encountered on a Rails 8.0 upgrade was:

    can't cast RSpec::Mocks::Double

The error happens on saving an ActiveRecord object to the database.


# connected :boolean default(FALSE)
# last_connected_at :datetime

class LymoAccount < ApplicationRecord
after_commit :update_last_connected_at, if: :saved_change_to_connected?

def update_last_connected_at
update!(last_connected_at: Time.current) if connected?
end

Turns out, this is related to stricter validation in Active Record, that refuses to save a mock object.

Generally speaking, you should be using FactoryBot methods to create real ActiveRecord objects from your unit tests. And we were. So it puzzled me why we would get this error, as it did not seem like we were storing anything that was a mock.

ChatGPT got pretty confused as well -- It got confused as the exception was thrown from an after_commit hook and its assumption was that there were attributes already set in the model that are being re-serialized and this was causing the issue.

We went through a listing of all the attributes of the record, examining their type (class) and none of them was a mock. 

This was the point when I gave up on Gen AI and took another look at the model.

I quickly eliminated that this has anything to do with the connected attribute that we are checking, by updating the test to save without the check. It didn't help, so I knew that the update itself was throwing.

Then I wondered if updating any column would throw the same error.

I updated a text column, and it worked - progress. Now I knew this might have something to do with either:

1. the specific column - maybe it has some validation that is behaving weird

2. the column type - maybe datetime columns behave differently with updates

Luckily there were a few other datetime columns, and when I updated any one of them with Time.current, they threw the same error. We were getting somewhere.

On a hunch, that this was to do with Time.current , I took a look at the unit test, to see if Time was being mocked - normally, we use Timecop as the best practice, but it was always possible that an engineer decided to be "creative".

This is what I found on the unit test:


  let(:data_sync_at) { Time.current.to_i }
  before do
    allow(Time).to receive_message_chain(:current, :to_i).and_return(data_sync_at)
  end
So what this does is stub the intermediate Time.current call, and it is not that obvious! So when we used Time.current to update the record, it tried to use a Mock object and failed.

A simple Timecop.travel(data_sync_at) fixed the issue.


Here is the Claude transcript, which happened later, when I was better able to guide the conversation along a more productive route!

Debugging Rails RSpec Error: RSpec::Mocks::Double Casting Issue

Q: On a Rails model, why would this code throw an error on a unit test saying: can't cast RSpec::Mocks::Double?
def update_last_connected_at
    update!(last_connected_at: Time.current) if connected?
end
Answer: The error occurs because connected? is returning an RSpec mock double instead of a boolean value, and Rails is trying to cast it to a boolean in the if conditional.

Common causes:

  • Unmocked associationconnected? might depend on an association that's mocked but not configured properly
  • Missing stub — The connected? method itself might be mocked but not given a return value

Solutions:

1. Stub the method explicitly with a boolean:

allow(model).to receive(:connected?).and_return(true)

2. Build a proper test object instead of relying on mocks:

let(:model) { build(:your_model, connected: true) }
Q: Happens without connected?
Answer: If you're getting the error without even calling connected?, the problem is likely that update! itself is being called on a mock.

Most common cause: You're probably testing this method on a mocked or partially mocked model instance. When you stub the model without fully setting it up, calling update! on it returns a double instead of actually updating the record.

Solutions:

1. Use create or build instead of double:

let(:model) { create(:your_model) }
model.update_last_connected_at

2. If you must use a double, stub update!:

let(:model) { double(:your_model) }
allow(model).to receive(:update!).and_return(true)
Q: Model is not stubbed, it is a FactoryBot created one
Answer: If it's a real FactoryBot instance, then the issue is different. The error suggests that update! is being called but something in the conditional logic is going wrong.

Most likely causes:

  • connected? method doesn't exist or returns a mock
  • The model instance itself is getting wrapped in a double
  • Database transaction/rollback issues

Debug steps: Add some debugging to see what's actually happening:

def update_last_connected_at
    puts "connected? returns: #{connected?.inspect}"
    puts "connected?.class: #{connected?.class}"
    update!(last_connected_at: Time.current) if connected?
end
Q: Connected is a column in the table (model). Here's my test and model:
let(:data_sync_at) { Time.current.to_i }
allow(Time).to receive_message_chain(:current, :to_i).and_return(data_sync_at)
// call method that ends up saving the record

# Model:
after_commit :update_last_connected_at

def update_last_connected_at     
  update!(last_connected_at: Time.current)   
end
Answer: Ah, there's the issue! You have an infinite loop of callbacks:
  1. update! is called in update_last_connected_at
  2. update! triggers after_commit
  3. after_commit calls update_last_connected_at again
  4. Which calls update! again... and so on

This creates a recursive callback that RSpec is having trouble with, and the mock you set up on Time.current might be interfering.

The real problem: You're missing the connected? check that should prevent this recursion:

def update_last_connected_at
    update!(last_connected_at: Time.current) if connected?
end

Or use update_column instead (skips callbacks):

def update_last_connected_at
    update_column(:last_connected_at, Time.current) if connected?
end
Q: My after_commit is like this so should not recurse:
after_commit :update_last_connected_at, if: :saved_change_to_connected?
Answer: Good catch! With that guard clause, it shouldn't recurse. But there's still an issue:

The problem: When update_last_connected_at calls update!, it triggers another after_commit. Even though the guard if: :saved_change_to_connected? prevents it from running again, RSpec is still having issues.

The real culprit is likely your Time mock:

allow(Time).to receive_message_chain(:current, :to_i).and_return(data_sync_at)

This is mocking Time.current in a way that might be interfering with the after_commit callback execution in your test. When you call update!(last_connected_at: Time.current) inside the callback, the mocked Time.current might be returning a double.

Try this instead:

Option 1: Mock just the .to_i part, not the whole chain:

allow_any_instance_of(Time).to receive(:to_i).and_return(data_sync_at)

Option 2: Use travel_to:

travel_to(Time.at(data_sync_at)) do
  # your test code
end

Option 3: Simplify by not mocking Time at all:

let(:data_sync_at) { Time.current.to_i }
# Just use the actual Time.current in your model

Saturday, May 17, 2025

Real time location of drivers : a tale of repurposing a Jupyter Notebook


At Solo, we automatically track driver location to calculate mileage—making it easy for our users to deduct travel expenses when filing taxes with the IRS. But we go far beyond basic mileage tracking. Our app breaks each day into individual “trips,” so drivers can see their full driving route in detail. Wondering where you lost the most time in traffic? Trying to remember that tricky apartment complex with no parking? Or the day you circled a golf course for 30 minutes? We capture all of it—and turn those moments into insights, delivered through an interactive map that helps you drive smarter.

To visualize driving routes, we use OpenStreetMap rendered through a Jupyter Notebook, all powered by a lightweight Flask server. The Flask server handles two core tasks:

  • Given a list of [latitude, longitude] coordinates, it plots the route on interactive map tiles.

  • It animates the route by syncing movement with timestamps associated with each coordinate pair.

We chose OpenStreetMap over Google Maps for a few key reasons that make it especially startup-friendly:

  • Cost-effective: OpenStreetMap is significantly more affordable than Google Maps, with no steep API pricing.

  • Highly customizable: From tile colors and custom markers to layer controls, the map styling is incredibly flexible.

  • Frequently updated: The map data is refreshed several times a day, ensuring accuracy and relevance.

On the backend, our Flask server handles dynamic map rendering. The render_map() function below takes in location data, timestamps, and speeds, then visualizes the route using Folium and branca—a powerful combo for interactive mapping in Python.

Here's how it works:

  • If a transition_duration is set, the function animates the trip using TimestampedGeoJson, syncing movement with time.

  • If no animation is requested, it renders a color-coded route based on speed, using folium.ColorLine.


def render_map(locations, epochs, speeds, transition_duration):
if transition_duration:
print("animating the path!")
return TimestampedGeoJson(
{
"type": "FeatureCollection",
"features": [
{
"type": "Feature",
"geometry": {
"type": "LineString",
"coordinates": [
[point[1], point[0]] for point in locations
],
},
"properties": {"times": epochs},
}
],
},
period="PT1M",
transition_time=int(transition_duration),
)
else:
colormap = branca.colormap.StepColormap(
["black", "#DB3A2D", "#003057", "#00BE6E"],
vmin=0,
vmax=120,
index=[0, 1, 5, 30, 1000],
caption="Speed (mph)",
)
return folium.ColorLine(
positions=locations,
colormap=colormap,
weight=4,
colors=speeds,
)

This is how an animation looks like:


I didn’t begin building production features in Jupyter notebooks. In fact, this all started three years ago with a much simpler goal: to understand our traffic patterns. As we expanded the product into new cities—and into different segments within larger metro areas—we needed answers. Where is traffic volume increasing? Where are drivers earning more in tips? These kinds of questions required a flexible geospatial analytics setup. Jupyter notebooks turned out to be the perfect environment to explore this growing volume of location-based data.

This is a rough look at our early days as we launched in Seattle:


That early exploration eventually evolved into a lightweight geospatial analytics pipeline—one that could handle real driver data at scale. Using Jupyter notebooks gave us the flexibility to prototype quickly, visualize patterns, and iterate. But as the insights proved useful, we started formalizing parts of that workflow. What began as an experiment matured into a production-grade service: powered by a Flask backend, drawing from location check-ins, and rendering driver routes with OpenStreetMap tiles—all orchestrated from within the same notebook-driven environment we started with.

This is exactly what makes working at a startup so much fun. At a smaller scale, we can take something like a Jupyter notebook—a tool meant for exploration—and ship a real feature to users through the mobile app. I know some of you engineers at Amazon or Meta might be shaking your heads, but that’s the beauty of it: tools that would never even be considered in a big-company tech stack become fair game at a startup. And sometimes, that unconventional choice turns out to be the right one.

This is the route of a driver that is plotted using folium on a React-native web-view:


And what happens when we do have millions of eyeballs on these maps? That’s not a crisis—it’s an opportunity. There are several clear paths to optimize for lower latency and scalability (hello, Leaflet and tile caching). But the key difference is this: we’ll be solving a real, validated need—not one we only thought users might have. That’s the advantage of moving fast at a startup. We don’t prematurely optimize—we ship, we listen, and we scale when it actually matters.

Bringing it back to maps—our rendering is handled by the Folium library, running within a Python Flask server. What’s nice about Folium is that it provides the same visual output in a Jupyter notebook as it does in production. This lets us prototype and test the map layout directly in the notebook before moving the code over to a Flask endpoint.

Here’s how it works: a web server sends the Flask server a list of GPS points to plot. The Flask server then renders the route using Folium and returns the HTML map back to the web server, which in turn passes it along to the mobile app.

For individual routes, this approach works surprisingly well. It’s not the fastest setup—since the full map is rendered server-side and sent to the client—but for shorter routes, the latency is acceptable and the experience is smooth enough.

Eventually, we wanted to display a real-time map of all our active drivers on a flat panel in our Seattle office. The simplest (and fastest) way to do that? Leverage the same system we’d already built.

So I added a new endpoint to the Flask server—one that accepts a list of GPS points and renders a small icon at each location. Different driver events are visualized using different icons. For example: a driver's current location appears as a yellow circle with a red outline; a new sign-up shows up as a gold star; and when a driver swipes a Solo cash card, a dollar sign icon pops into view.

Well, that was the easy part. The real challenge was figuring out how to track all these events in real time so we could continuously update the map every few minutes.

To manage this, I used several Redis sorted sets, grouped by event type:

  • EVENT_DRIVING

  • EVENT_SIGNUP

  • EVENT_SWIPE

Each set holds user IDs as members, with their current <latitude, longitude> stored using Redis' GEOADD command. These sets guarantee that each user has only one location entry, so as we receive location updates, we simply overwrite the previous value—giving us the user's most recent location at any given time.

But there's a catch: if a driver stops moving or goes offline, their entry becomes stale. Redis does support TTLs (time-to-live), but it doesn't allow expiring individual members of a set. So I had to get creative.

To work around this, I store a separate key for each active user using a naming pattern like LIVE_EVENTS_<user_id>, and assign a 5-minute TTL to each. Then, every 10 minutes, I scan through the geo sets and prune out any user IDs that no longer have a corresponding LIVE_EVENTS_* key—effectively cleaning up stale locations.

And that map you see at the top of this post? It was built exactly this way—stitched together from Redis geo sets, rendered by a Flask server, and piped straight from a Jupyter notebook prototype into production.


Wednesday, March 13, 2024

Postgres indices on large tables : gotchas

When you run a migration to create an index on Postgres, to allow queries to run, we create the index using the `CONCURRENTLY` flag.

But if the migration fails for any reason, the index will be created but unusable. Say, you were adding a UNIQUE index, and the migration fails since it encounters a duplicate. So the migration fails with something like:


Now imagine that your migration needed to make an existing index UNIQUE. It is usually done by first removing the index, and adding it back with the UNIQUE constraint.

Since the migration is aborted at the point of creating the new index with the constraint, now there is no index. The app will be running without an index.

If you were to check the db, you might get confused as the index *seems* to be there - it is just not operable.

To verify, run an `EXPLAIN` and you will see it does not use the index.

Now the queries that regularly use the index will be running quite slowly, as the index is not quite ready. This could add a lot of pressure to the db and make the app pretty much unusable / inoperable.


Wednesday, January 10, 2024

Ruby lazy collections and with_index


The lazy collections don't quite give us a way to use `with_index` , but, we can use `each_with_index`.

It took me a moment to figure out the problem was with the collection being lazy.

Thursday, August 25, 2022

Using Redis for web request counting


Problem Statement

With the growth of our user base and increasing traffic to the web servers, we wanted to come up with some realtime counters to measure traffic.

We wanted the system to give us an idea of:

  • The total web requests the site is receiving each minute
  • These totals aggregated hourly and displayed for the day (24 entries)
  • The counts broken up by the specific request path
  • The number of unique visitors broken up by the minute, hour and day

Limitations of available solutions

We use Heroku for deploying the app. The Heroku dashboard provides us a rough idea of the request counts, but it is difficult to incorporate that into our own operational dashboards. Also Heroku doesn't break down the counts by the request path, which was important to us in understanding the source of traffic and how we could scale resources based on the source. Unique visitor counts are similarly an important metric not readily available.

Counters help scale the app

Breaking down the traffic by the source was important in coming up with a way to efficiently scale our service. Currently most of our application sits in a single service. So scaling the app means we add machines to this single fleet, even though only requests from one or two sources really benefit from this added capacity.

We have 3 main sources of traffic:
  1. Our users hit the service for various features provided from their mobile app
  2. Our users send us their geo location from the mobile app
  3. We receive near real-time data of our users gig work from a third party
Our primary application performance goal is providing a sub second experience to users as they use our mobile app; thus mainly, we want to optimize resourcing on the backend with a focus on 1.

However, we get so much more traffic from 2. and 3. which consume most of the server bandwidth. Keeping all three services as a single service degrades the experience for the user.

Mind you, 2. and 3. do not have a real time processing requirement. While a web server is needed to accept these requests, the actual processing is handled by an asynchronous worker outside of the web server.

But still, since there are so many of these web requests, for the few milliseconds each of them sit on the web server, it takes away bandwidth from the user requests.

Why Redis?

Redis provides the ideal data structures for counting requests with minimal overhead.  (And must I say that it is fast, as in really, really fast) A few keys can be used to keep a running total for each minute per request type, then a sorted set can be used to aggregate the last N minutes of requests. (For our purposes, we decided to keep 60 counts, thus providing a picture of activity for the last hour, but you can choose to keep counts for longer than that.) 

The same idea can be extended to measure days worth of traffic broken by the hour.

Choice of the Sorted Set

Why did we decide on the sorted set for aggregating the counters? Well, the sorted set allows us to have the counters sorted by time. This way, we can quickly get the list of counts for the last hour ordered from minute 1 down. To be fair, it is a bit overkill to use a set for this, as we are never going to be mutating an element (since the timestamp is always increasing), but it does suit our purposes just fine!

Before going any further, let us briefly recap the salient features of the sorted set. It allows us to insert elements along with a score, and the elements are sorted in real time by the score. It scales really well for even millions (or more) of elements as each insert operation takes O(log(n)) time -- much like a binary tree. While we do not need that level of scale, one can think of keeping extremely granular counts for a long period of time, which could come in handy for debugging bizzare performance problems after the fact!

We can use the timestamp as the score. Redis will then always sort the set by the timestamp. This has the advantage that if you wanted to change the counter later (imagine a design where you quickly provide a rough estimate of the count, but later do a second pass to provide exact counts), you can simply add a new count to the set with the same timestamp and the position of the element will not change.

The counters will need to be reset at the start of the minute. I first made the mistake of using the expiry time of the key set to 1 minute, but realized that this introduces a race at the point of aggregating the count on to the sorted set. Which is that we may be unlucky that before the aggregation, redis could have expired the key, resulting in a substantial undercount in the set. (This was a difficult bug to track down, and of course the most obvious, I had a face-palm moment as you can imagine.)

There is a slight difficulty we need to work around here w.r.t the sorted set. If we keep the count as the element in the set, a count that happens to be the same as one already stored will replace the previous count (with the score modified). Since we are using the timestamp as the score, this will essentially remove the entry we had for the earlier timestamp. This is how sets work after all - it is a data structure suited for keeping unique members. But we can easily overcome this by prepending the timestamp of the count to the count and storing that as the element of the set. To read the count, we merely have to split the element by the delimiter (we used the colon here for the delimited, which is somewhat of a standard in redis for splitting keys), and use the second part.

A look at the running counters

A ZRANGE command can retrieve the counts like so:


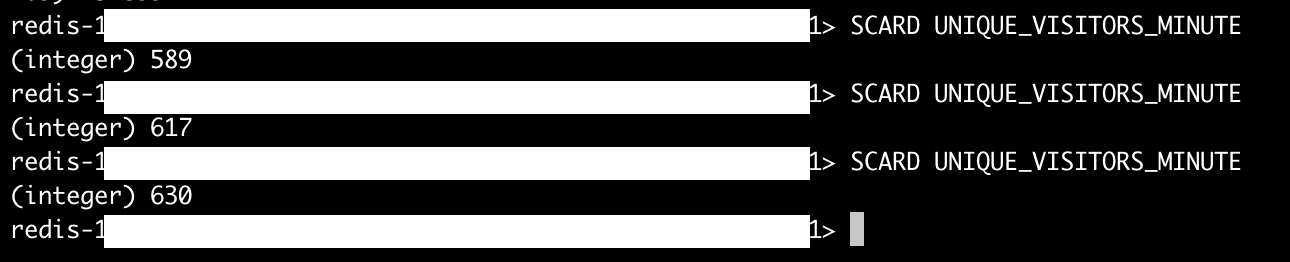
Counting the unique visitors is only slightly more involved. First we need to keep a regular Redis set and update it for each request. In our case, the user id is encoded in the request header, we decode it and add it to the Redis set. Now if the same user visits the site again, since we are using a set, we will not add it again, and we still have just one element in the set. This way, we can take the length of the set at any point and know how many unique visitors we have from the time we started writing to the set.

The only thing left to do is, create the set at the start of the time interval we need to measure the count, and reset it at the end of the time interval. So we can set this up to reset every minute for a minute by minute count of unique visitors. Then we can use the infrastructure we built above to aggregate the count over to the sorted set, so we have a running count of unique visitors for the past N minutes.

(You may have a different technique for figuring out the ID of the user making the request. Once the ID is extracted, you can use a Redis set to keep track of the visit.)

Here is how we see the unique visitor count changing dynamically:


We can just as easily use another excellent Redis command to see all the user ids in this set. Here is a snippet in our case :


Implementation

We implemented the counters using Ruby, with the redis gem as our client. This involves several steps:
  1. Initializing the counters
  2. Resetting the counters at minute, hour, day intervals
  3. Incrementing the appropriate counters for each request
  4. Aggregating the count onto the set
The first two steps can be combined. We used a scheduler that sits within the app via the ruby clock gem. Heroku allows provisioning a single process that runs a scheduler based on the schedule we set via the ruby clock. This is pretty similar to how one would use cron on a Unix machine to schedule a task.

Heroku does provide a scheduler as well. We did not use it as it does not have the same reliability guarantees as the ruby clock gem. I have seen cases where the Heroku scheduler does not fire and fires very late, all documented behaviors.

Since we use Rails for our app, we utilized its framework built on top of controllers to track request counts.

A controller encapsulates serving requests for a specific web route (think of this as having one controller for yoursite.com/user/login and another controller for yoursite.com/reports/account). Now each controller is a subclass of a class we implement called ApplicationController which itself is a subclass of the Rails class ActionController::Base.

Rails allows us to hook all requests at the ApplicationController level with a simple before_action hook. We implemented the request counting using this hook, and it looks something like this:

class ApplicationController < ActionController::Base before_action :update_usage_counters def update_usage_counters PerfCounters.increment(user_id: current_user&.id, request_path: request&.fullpath) end end

Now each request goes through update_usage_counters, which delegates the work to the PerfCounters class we wrote. request is an object provided by the Rails routing framework, and request.fullpath contains the URL. The method current_user (not shown) extracts the logged in user's ID from the request headers.

I will reproduce pieces of a simplified version of PerfCounters that will illustrate the logic:

The incrementing logic looks like this:
class PerfCounters def self.increment(user_id:, request_path:) $redis.pipelined do |pipeline| if user_id.present? pipeline.incr('USER_REQUESTS_MINUTE') pipeline.sadd('UNIQUE_VISITORS_MINUTE', user_id) if request_path&.include?("/geo/send") pipeline.incr('GEO_REQUESTS_MINUTE') end else pipeline.incr('OTHER_REQUESTS_MINUTE') end end end end

Notice that a request made on behalf of a logged in user will have user_id parameter set. The request_path is the path of the URL, and we use it here to separate the counts made to track the location of the user.

Another neat redis feature we use here is pipelining. The idea is that if we need to make a number of independent requests to redis, we can open a socket to the redis server and send all that data and close the socket at the end. Redis server will return an array of replies in order after it processes all requests. This is a powerful feature that is more efficient than creating a socket for each separate request. It is not without cost - as the server has to buffer each request, technically blocking the request thread from processing other requests. The rule of thumb is to make sure that each request is pretty fast - O(1) would be ideal, and to not pipeline too many requests in a single call. As with everything, you must test this against all the other traffic you serve and compromise if you must!

Also notice that we are demonstrating the use of three counters USER_REQUESTS_MINUTE, GEO_REQUESTS_MINUTE and OTHER_REQUESTS_MINUTE, alongside a set called UNIQUE_VISITORS_MINUTE. This last one actually keeps the user ids of all visitors. The sadd command adds the visitor id to the set upon the first time we see them.

The ruby clock gem takes its inputs via a file named Clockfile. This is in fact a file that uses ruby syntax, i:e it is evaluated by the ruby interpreter. All we do is define the aggregator to run every minute, like so:

schedule.cron '* * * * *' do PerfCounters.aggregate_minute end
This is what the minute aggregation looks like:
def self.aggregate_minute tm_obj = Time.current - 1.minute # aggregate last minute's stats tm = tm_obj.to_i # get all current minute counters, add them to the hour list before zeroing them out user_rpm, other_rpm, geo_rpm, unique_visitors_last_minute = $redis.pipelined do |pipeline| pipeline.get('USER_REQUESTS_MINUTE') pipeline.get('OTHER_REQUESTS_MINUTE') pipeline.get('GEO_REQUESTS_MINUTE') pipeline.scard('UNIQUE_VISITORS_MINUTE') end $redis.pipelined do |pipeline| # ZADD key score value : keep timestamp as score so we get the counters sorted by time # append the timestamp to the counter to make sure entries don't overwrite. pipeline.zadd('USER_REQUESTS_LAST_HOUR', tm, "#{user_rpm}:#{tm}") pipeline.zadd('OTHER_REQUESTS_LAST_HOUR', tm, "#{other_rpm}:#{tm}") pipeline.zadd('GEO_REQUESTS_LAST_HOUR', tm, "#{geo_rpm}:#{tm}") pipeline.zadd('UNIQUE_VISITORS_LAST_HOUR', tm, "#{unique_visitors_last_minute}:#{tm}") pipeline.del('USER_REQUESTS_MINUTE') pipeline.del('OTHER_REQUESTS_MINUTE') pipeline.del('GEO_REQUESTS_MINUTE') pipeline.del('UNIQUE_VISITORS_MINUTE') end end
As you can see, there are two types of counters. One tracks the count for each minute, the other aggregates it for the hour. So for example, take USER_REQUESTS_MINUTE. This is incremented for each request made on behalf of a logged in user. Then upon the dawn of the minute, this counter is added to the sorted set USER_REQUESTS_LAST_HOUR and then immediately deleted.

You can chop the aggregations every Mth hour since otherwise these sets will keep growing eventually taking all of Redis memory! I won't show that code, but it should be fairly straightforward to implement.

After having implemented this solution and writing this article, I have come to see that there are other ways to implement counting using Redis. Redis provides such a versatile set of data structures and algorithms that there is always a simpler or more elegant technique somewhere!

For example, when we use a container like a sorted set or a list, we must set its bounds, clearing it at certain time intervals and thus restricting its memory usage. But if you use the Redis stack, there is an excellent data structure - the Redis Timeseries that does much of this bookkeeping for you. Basically, you can configure the time series to expire old entries (something that most other Redis data structures do not do for you - you can expire the complete key or nothing at all). Besides that it has commands very similar to the set or the sorted set.

Another advantage of a time series vs a sorted set would be the trivially simple management of a "rolling" window of counts. This is typical in performance monitoring that you want the "last 72 hours" or the last "30 days" of performance data, which is more useful than data "for all of today" or "for the current hour".

I leave this as an exercise to the reader. Maybe I can talk about this in greater detail in a future article as well!

Friday, December 18, 2020

Set GIT Hash on Heroku Deploys


There are several ways to set the GIT hash for heroku. I prefer setting this just before pushing the main branch to the heroku remote.

Also, I prefer to automate this with a `pre-push` hook.

One issue I ran into was that it was not straightforward to know if there is anything to push. Meaning, if the remote was up-to-date or not. This is important, as we don't want heroku deploying a version when there are no changes to be deployed (which it will if we set the APP_VERSION).

The simplest way to know if the remote was already up-to-date seemed to be to do a `--dry-run` of `git push`.

But of course that runs the hook again, so this is an endless loop situation.

It does not seem that git allows us to see the git argument on the hook. If it did, we could explicitly not run the hook on a dry run.

But there is a `--no-verify` option that bypasses the hooks, and can be used when we do our dry run.

Here is the complete script:


Saturday, November 30, 2019

Rails database migrations on a cluster with AWS CodeDeploy

A typical Ruby / Rails solution will comprise of a number of web servers behind a load balancer. Each of the web servers will read/write from a central database. In the course of new features being added to the application, the database schema goes through changes, what we refer to as "migrations".

When new code is deployed, the migrations that are needed for new code needs to be run first. If AWS Code Deploy is used for deployment of new code, we can set up the AfterInstall hooks to run the migrations before re-starting the web server.

So the usual flow in a deployment goes something like this:

  1. Stop the web server
  2. Migrate the database
  3. Start the web server

However, our application is hosted on a number of web servers. We don't want to bring down all servers at once. A typical blue/green deployment will have us deploy to just one third of the server fleet at once.

So if we have 27 web servers, we will be running the above steps on 9 of them at the same time. The main problem with this is that when the Rails migrate runs on multiple servers at once, it is likely to fail on a number of them. This is because Rails takes an advisory lock on the database and throws an exception on concurrent migrations. You can read more about the advisory locking here as well as a way to work around the problem.

But the solution is not without its drawbacks. If you prevent the migrations running on all but one machine, it is possible that the new code will be deployed sooner on those machines before the migration has finished. This is specially true for long running migrations. Then there is potential for new code to be running against an old database schema. New features that depend on the new schema will likely fail.

A better solution would be:
  1. Run the migration on a single instance - this could be one of the web servers, or a dynamically provisioned EC2 instance that can access the database.
  2. For all web servers
              2.1 Stop the server
              2.2 Deploy new code to it
              2.3 Start the server
The advantage of this solution is
  1. We side-step the concurrent migration issue. We run the migrations on a single instance and then do the rest of the deployment without incurring any database issues.
  2. We bring up the new code only after the database is migrated, so the new features work reliably from the start.
So the new database schema changes need to be backward compatible. But this is a general constraint we have anyway since on a blue/green deployment some part of the code is old and will be hitting the new database.

While this solution is pretty straightforward, it requires some effort to implement this in the AWS CodeDeploy environment.

What I ended up doing was to use a new Deployment Group (called staging) to bring up a single EC2 instance, change the start up code to only run the migration on that deployment group. Then I hooked this deployment group right after the deployment to a test instance, but before the code is deployed to the production servers.

In the startup code, we can check the current deployment group via ENV['DEPLOYMENT_GROUP_NAME']. In our scripts, we set the RAILS_ENV equal to the Deployment Group. This allows code to take different paths based on where it runs (in a local dev environment, a staging server or like in this case on a migrator server).

This is what our migrate script now looks like:


It is important to set the inequality, as we want the migrations to run on our test servers - we just don't want them running on the production web servers.

We add this to our database.yml, notice the environment is staging, to match the deployment group. Notice the database is the production instance.


In our case, we read credentials from AWS Secrets Manager. You don't have to.

This is how our staging step in CodePipleline looks like:


On the last CodeDeploy step, hit the edit button and set the Application Name and the Deployment Group correctly.


Now before the code is deployed to the production servers, the database migration has been completed on the staging instance. If the migration fails, CodeDeploy won't advance to the deploy stage. When the production servers start with new code, they will all use the new database schema.

After the migration has finished and before code is deployed, the old code will start using the new database schema. As long as the new schema is backward compatible, this will not cause a problem.

You may have to run the release pipline a few times till AWS co-operates with the new changes. But it should eventually start working.